A&D Connect: Great Tool Motivates You to Be Active in Daily Health Management
I am testing the new “A&D Connect” Platform developed under the “WellnessConneted” concept which we launched in the US market last year for Apple iOS devices, such as iPhones or iPads. (http://www.wellnessconnected.com/) I have found it truly motivates me to monitor my blood pressure and become more active in my daily routine, as it shows various data and trends of my daily activities in an easy-to-understand fashion. The first screen shot (Figure 1) is the dash board which shows the latest biometric data on one screen. It shows the last data uploaded from my activity monitor, my blood pressure reading from the Continua-certified UA-651BLE, and the glucose data I manually entered.
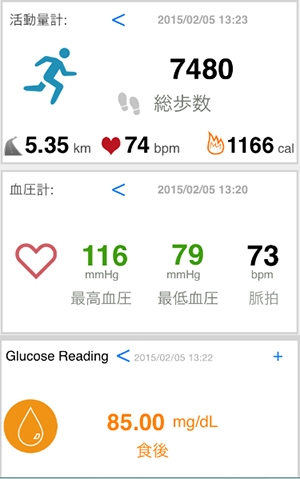
Figure 1
The second screen shot on (Figure 2) shows how far I have gone in relation to my daily activity goals. This really motivates me to take a walk at every opportunity, and ever since I began wearing this device I have been prompted to walk to the office instead of having my wife drive me there, which had become a routine for quite a while recently. Looking at the weekly chart of steps taken (the bar graph Figure 3), I realize how sloppy I had been last Saturday and made me regret my hesitation in going outdoors because of the cold weather. The latest data I checked today shows I have already taken close to 5,000 steps today, which indicates I had already taken quite a reasonable walk as of 10 o’clock this morning.
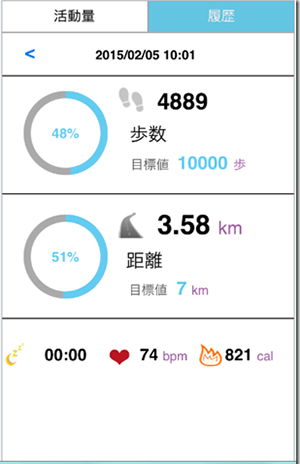
Figure 2
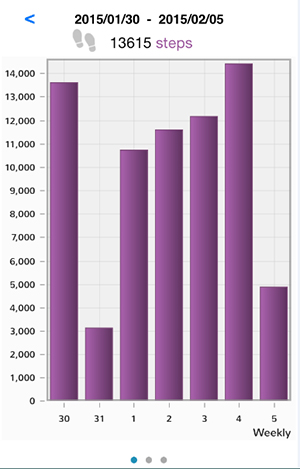
Figure 3
You can send this graphic data along with numerical data to your Facebook account or any email address you use. If you want to store data so that you can see it via your PC or other IT device, you can upload the data to a cloud server as well. For those who are concerned about blood pressure readings, you can have the raw data printed out as shown in Figure 4 and bring it with you to the doctor. As self-measurement of blood pressure at home is becoming vital for cardiovascular disease diagnostic and management, this kind of easy-to-handle data will offer great advantages for one’s personal health management. If you want to have a glance at trends in your blood pressure readings, you can do so easily by looking at the graph shown in Figure 5.
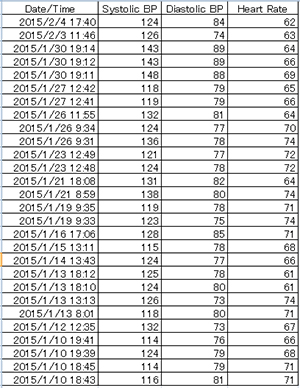
Figure 4
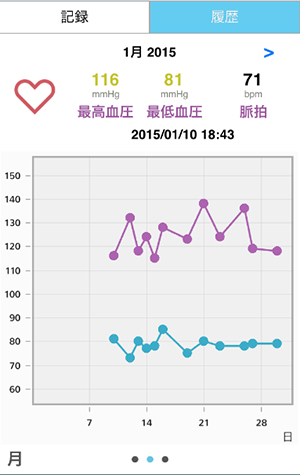
Figure 5
Sorry if you do not have access to the benefits of the A&D Connect Platform at present and cannot experience the excitement I am presently enjoying with it, but we will be making it globally available shortly.
A&D Connect: Great Tool Motivates You to Be Active in Daily Health Management (PDF File 187KB)